Skip navigation

Category Archives: Computational

Recently generative design has become a significant tool for defining corporate identity elements.

Visual identity of MIT Media Lab is a good example. The logo can be transformed into 40.000 variations without losing it’s essence. Just watch the video and enjoy.

Image

Another project is from Onformative on creating color pallette for their website, called Color of the Day . They developed a method for generating a flexible vivid color spectrum for the links to be highlighted on their website.

ImageCr

One of our recent MA graduates, Sinan Büyükbaş is a very talented guy indeed – one whose skills extend into many different areas, from sound design to video to graphic design. Above are a few images from his latest creative foray, his 3D Kandinsky typeface. More images can be seen here:
http://www.behance.net/gallery/KANDINSKY-TYPE/4039379

And 2 months later I am back with this update:

He went and made it to the front page! :-)

http://www.graffititechnica.com/

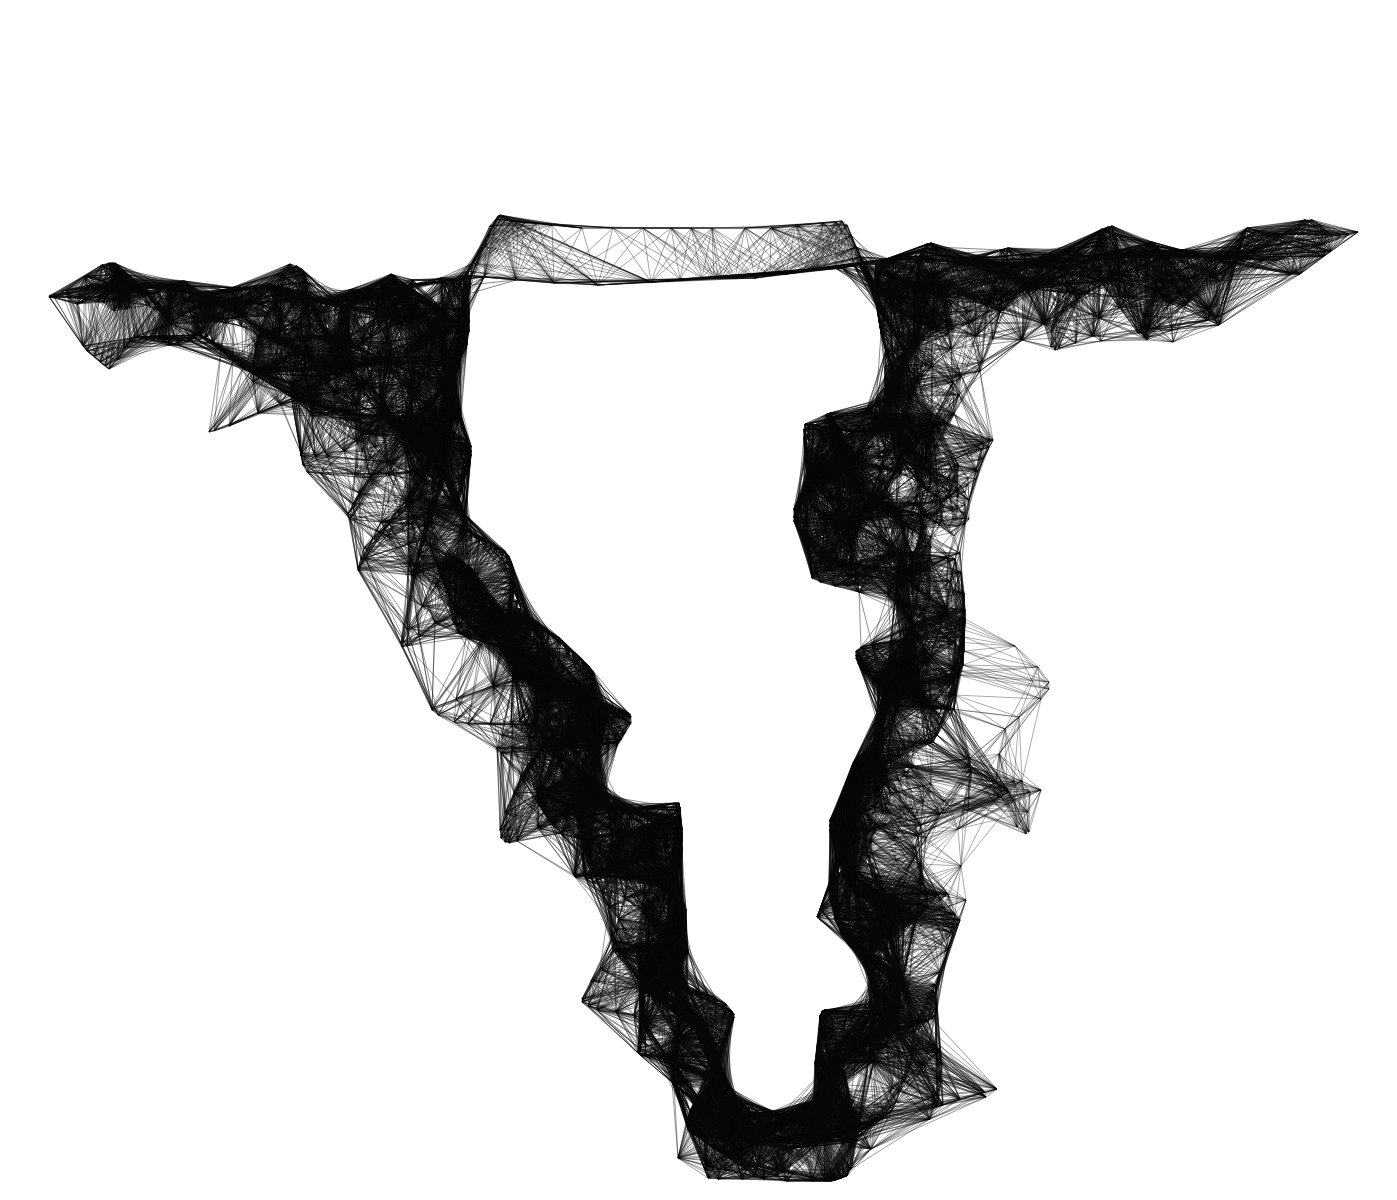
This is a nice tool for interactive drawing. Using Jay’s application you can draw really complex (and cool!) looking images. It’s basically a line drawing tool where you just put dots on the canvas and they create lines – But the trick is, the new point you put gets connected with the nearest dots you already drew. The result is a geometric line explosion and it really looks incredible if you use it the right way (just look at the images). There is a <a title=”web app for sketchy structures” href=”http://jayweeks.com/sketchy-structures-html5-canvas/#/ web application that you can instantly play with and also an Adobe Illustrator Scriptographer script  (for the latter, take a look at scriptographer page on how to install and use it- it’s an amazingly good tool for illustrator fans!, you’ll thank me..)

Sabanci University’s interest in supporting research output has been one of the primary initiatives of Image of Science, which will now run its second season July 11 – 15 on campus. Image of Science is a university wide collaboration, open to outside participation this year, organized by visiting faculty Gokhan Ersan (School of the Art Institute of Chicago),  Melih Papila (FENS), VAVCD teaching assistants, and Nancy Karabeyoglu (SUWC).

Image of Science seeks to familiarize researchers with design tools that can comprehensively depict complex research methodologies and findings. 

This year’s week long program of workshops and design tutorials focuses on creating interactive slide shows and presentations of completed or ongoing research. Two days of workshops on implementing design strategies open the program; three days of design work to produce interactive slide shows/presentation of selected submissions follow. All are welcome.

If you have  a visual image of a particular ongoing/completed research project and/or would like to learn more of design’s ability to serve as a powerful information source, please consider attending either the workshops or design production; both are free.

The links below are the formal invitation to Image of Science.

Website

http://iscience.sabanciuniv.edu

Registration/Submissions 

http://iscience.sabanciuniv.edu/workshop-apply/apply-ws2.html

Pages containing the work of last year’s projects

http://iscience.sabanciuniv.edu/projects/projects-emrah-p1-intro.html

http://www.rizon.be/#/work

Magnificent! Created by Alex Beltechi, seen on behance.

Ligature frenzy is at the door. Unless you are an able graphic designer, you don’t get to play with ligatures. It’s mostly unavailable but when you have it, the results become so elegant. This is a nice example how ligatures can be used besides linking f-l or f-i. Simple and neat, yet it can be very useful and stylish. Text from the page:

Chartwell is a family that explores the use of OpenType to interpret and visualize data. The font format is highly portable and can be used in any application that supports standard ligatures. The data also remains editable allowing for easy updates.

Tigre Milena, aka. Doni Parlanti is a high powered professional in a field completely unrelated to Victorian fairy tales.

In her “other” life Tigre is an avatar in the virtual world of Second Life®, where she shows some extraordinary skills and talents which have nothing whatsoever to do with the demands of her “Real Life” job: Tigre sets up complex scenes (which are actually lived-in locations within her own virtual home), populated with the costumed avatars of her close friends as well as her own “alt” avatars. She then takes virtual photographs of these scenes and proceeds to re-create them as 19th century inspired illustrations, which she does in fact “dedicate to all the great Victorian illustrators of children’s books”. The outcome is simply stunning, as the images below will show. Small wonder, since before all else Tigre holds a degree in arts and crafts. Since Tigre does not have a dedicated domain for these beauties I am going to link all of the series to here:

“Bedtime Tales”

“Where’s the cheese?”

“Charades” (inspired by  the book Vanity Fair (1848) by William Makepeace Thackeray)

“A scrub in the tub”

Google Creative Lab engineer/designer Alexander Chen turned NY subway lines into an interactive musical instrument. Very neat and minimal, yet pretty poetic in a way. Developed in HTML5 and the subway template is based on Massimo Vignelli’s original design. Each subway line becomes a string and with each intersection you get a pluck. The length of a line also determines the pitch and how the lines emerge is determined by using MTA’s live arriving and departure times, plus some of Chen’s additions. Likes!

(click on the image to see how it works)


http://www.substudio.com/
http://www.flickr.com/photos/michaelpaukner/

This java based application transforms a simple product bar code into a unique tree in the garden of globalization. Taking advantage of this rich pool of information Barcode Plantage creates a series of visualizations based on a set of default bar codes. Once a bar code is keyed or scanned in, the program sends a request to the database, which returns a master file data. This master file data is then analyzed to define positions, curves and colors of Bezier curves of the tree structure. The number of these curves will vary correspondence to the number of figures in the code. Simultaneously, the user will hear a melody, which is based on the figures of the bar code. To complete the visualized information details of the country of origin, manufacturer, product number and sum – each on a single black bar connected by fine lines ? are displayed. Since all data is being interpreted by an algorithm that works completely without any random aspect each product is represented by a characteristic and singular tree. [Visual Complexity]

http://www.barcode-plantage.com/

http://vimeo.com/18469695

http://www.complexitygraphics.com/

http://www.behance.net/gallery/CHAOS-AND-STRUCTURE/892355

SU/VACD alumnus Başar Önal is currently a PhD student at SPIRE, the Participatory Innovation Research Centre at the University of Southern Denmark and also works as a researcher at DRU, the Design Research Unit at the Interactive Institute. His portfolio, which consists of intelligent, sophisticated art and computation hybrid projects can be viewed here:
http://portfolio.basaronal.com/

Wettext (above): The prototype is a modified DIY lie-detector. Normally the detector senses the stress reaction (moisture) in one’s fingertips and signals it. In my model, the output is used to delete and recombine the parts of the old text in order to produce a real-time, animated, new body of text. The old text is presented alongside the new one, and the person connected to the detector will be producing a constantly changing written piece.

Maximachines (above): The idea for this conceptual robot is devised with the concept of visceral design (Donald Norman). It is conceived with an apocalyptical, post-crash future in mind. These robots are a thinking exercise for a dystopian future, and would be useless in a future with pleasantly aligned resources. Thus, there needs to be an environment of risk, both physical and psychological in order to accommodate these kinds of robots. They can act as objects of psychological projection in times of distress, objects of reflection, and perform a function that would otherwise be harmful for humans.

needless to say. cool. check out balint’s portfolio too!

Trace is a sculptural device that alludes to scientific discoveries and pseudoscientific concepts such as phrenology, physiognomy, and craniometry. A revolving plaster cast of the artist’s head is slowly deconstructed into a mathematical diagram that changes as time passes. The peculiarities of the human face that as humans, we attach so much importance to, is dematerialised into a changing drawing that embodies the differential undulations of the human anatomy. ‘Trace’ questions our notion of self and how through technology we have found different visual representations for the individual. DNA profiling, retina scans and the fingerprint are all things that are conjured up by the meticulous mechanical process of the work. The topographical images are turned into a new form of three-dimensional representation that draws our attention to the ‘space within’.